Diagnosing and Fixing a Slow Query, Step by Step
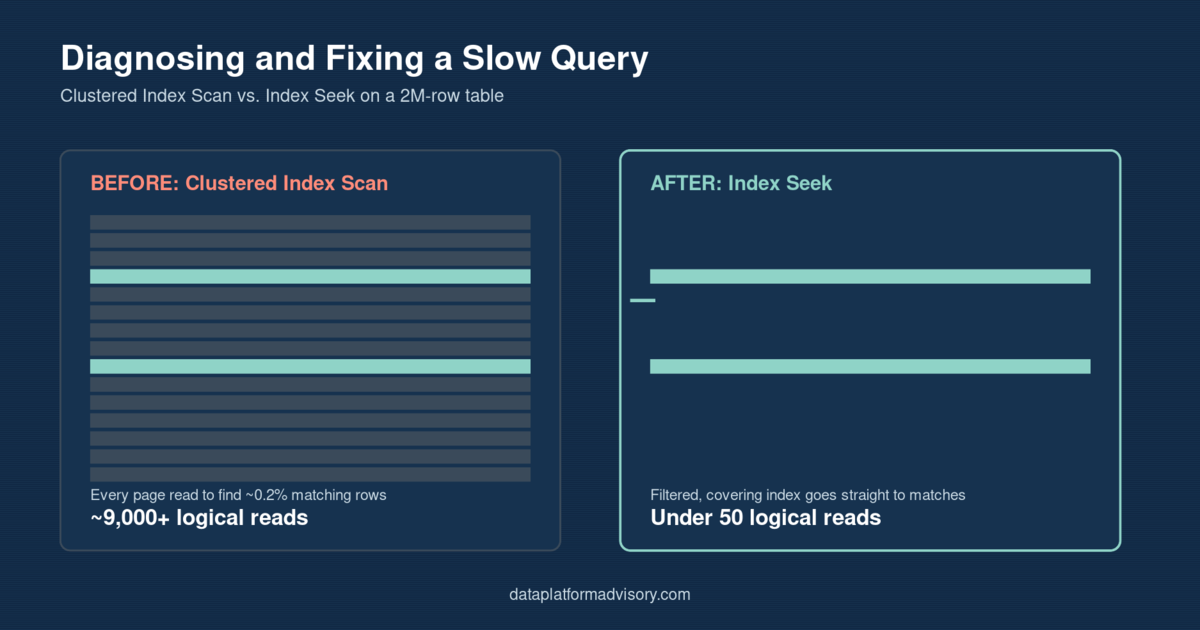
A query that scans an entire table to return a few thousand rows out of two million isn’t a mystery — it’s a missing index, and the fix usually takes ten minutes once you know where to look. This post walks through one real pattern end to end: a support dashboard that got slower every month, why it got slow, the exact fix, and a scheduled, human-approved way to catch the next one before it becomes a ticket.
Key takeaways
- A full clustered index scan on a large table for a narrow predicate is the single most common cause of “this query used to be fast” tickets
SET STATISTICS IOand the execution plan’s Scan vs. Seek operator tell you the story faster than guessing at query text- SQL Server’s missing-index DMVs are a lead, not a verdict — always check for near-duplicate indexes and real query volume before adding one
- A filtered, covering index fixed this case: logical reads dropped from ~9,000+ to under 50
- AI can watch for this pattern instance-wide on a schedule, but it should only ever produce a report for a human to approve — not create indexes on its own
The problem
A support team runs a dashboard every few seconds that shows all pending orders, newest first:
SELECT o.OrderId, o.CustomerId, c.CustomerName, o.OrderTotal, o.OrderDate
FROM dbo.Orders o
JOIN dbo.Customers c ON c.CustomerId = o.CustomerId
WHERE o.OrderStatus = 'Pending'
ORDER BY o.OrderDate DESC;
Six months ago this ran in under a second. Now it takes several seconds, sometimes longer under load, and it’s dragging down everything else hitting the same table. Nothing about the query text changed — the table just grew, from a few hundred thousand rows to two million, and Pending orders are a thin, hot slice: roughly 0.2% of the table.
That’s the pattern to recognize immediately: a narrow predicate on a table that’s grown well past the point where a table scan is cheap. If you’ve been doing this long enough, the diagnosis is almost reflexive — the question is never “is there a problem,” it’s “does an index already exist to serve this predicate,” and the answer here is no.
Turning on SET STATISTICS IO ON and SET STATISTICS TIME ON before running the query confirms it in the Messages tab: a scan count of 1 against Orders with logical reads in the thousands — essentially every page in the table, just to filter down to a fraction of a percent of rows. The graphical execution plan (Ctrl+M in SSMS before running) shows the same thing visually: a Clustered Index Scan operator on Orders, with the “Actual Number of Rows Read” far larger than the “Actual Number of Rows” returned, plus a yellow missing-index bang at the top of the plan.
The expert fix
SQL Server’s missing-index DMVs will suggest a shape for the fix, and they’re a reasonable starting point — but treat the suggested cost-reduction percentage as a lead, not a verdict. As Erik Darling has written about missing index requests, the DMV’s estimated percentage doesn’t map cleanly to actual execution time saved, and for queries with inequality predicates the reported cost information gets even less reliable. Before creating anything, check sys.indexes for what already exists on the table — adding a near-duplicate index just doubles write overhead without fixing anything.
For this query, the right fix is a filtered, covering nonclustered index:
CREATE NONCLUSTERED INDEX IX_Orders_Pending_ByDate
ON dbo.Orders (OrderStatus, OrderDate DESC)
INCLUDE (CustomerId, OrderTotal)
WHERE OrderStatus = 'Pending';
Three design decisions matter here, and each one is doing real work:
Filtered on OrderStatus = 'Pending'. The index only has to cover ~0.2% of the table’s rows instead of all of it, which keeps it small and cheap to maintain. The tradeoff: this only pays off as long as the dashboard’s predicate stays stable. If it later needs to filter on multiple statuses, drop the filter and index OrderStatus normally instead.
Sorted OrderDate DESC. The dashboard’s ORDER BY matches the index order exactly, so SQL Server doesn’t need a separate sort operator on top of the seek.
INCLUDEs the columns the query actually selects. CustomerId and OrderTotal ride along in the index leaf level, so there’s no key lookup back to the clustered index for every matching row.
Re-running the same query with STATISTICS IO on after the index is in place shows the shift: logical reads on Orders drop from the thousands to well under 50, and the execution plan operator changes from Clustered Index Scan to Index Seek, with the sort operator gone entirely. The full script, seed data to reproduce the ~2 million row table, and before/after evidence are in the companion example on GitHub.
The AI-automation angle
The fix above required someone to notice the dashboard was slow, then go looking. The more useful version of this is catching the pattern — a hot, narrow predicate with no supporting index — before it turns into a ticket, across every table on the instance, not just the one someone happened to complain about.
That’s a good fit for a scheduled, read-only watcher: query the missing-index DMVs instance-wide, score the candidates by estimated impact weighted by how often SQL Server actually wanted that index shape (discounting one-off ad hoc queries), and log them to a review table. Critically, it never runs CREATE INDEX itself:
INSERT INTO dbo.IndexCandidateLog (TableName, EqualityColumns, InequalityColumns,
    IncludedColumns, AvgUserImpact, TimesNeeded, Score, SuggestedDDL)
SELECT
    mid.statement, mid.equality_columns, mid.inequality_columns, mid.included_columns,
    migs.avg_user_impact, migs.user_seeks + migs.user_scans,
    migs.avg_user_impact * LOG(1.0 + migs.user_seeks + migs.user_scans) AS score,
    N'CREATE NONCLUSTERED INDEX ...'  -- suggested DDL, for review only
FROM sys.dm_db_missing_index_details mid
JOIN sys.dm_db_missing_index_groups mig ON mig.index_handle = mid.index_handle
JOIN sys.dm_db_missing_index_group_stats migs ON migs.group_handle = mig.index_group_handle
WHERE migs.avg_user_impact >= 50.0
  AND (migs.user_seeks + migs.user_scans) >= 10;
A DBA reviews the scored report — daily, or however often makes sense — and explicitly flips a row from pending_review to approved before anything gets applied. On tables where an index build taking a lock costs real money, that gate isn’t a formality; it’s the whole point. AI is genuinely good at the tedious, continuous pattern-matching this requires across dozens of tables. It’s not the thing that should decide when a production table takes a schema change. The full watcher script, plus a PowerShell wrapper for scheduling it under SQL Agent or Task Scheduler, is in the companion example.
If your team is fielding “this used to be fast” tickets and doesn’t have a systematic way to catch the pattern before it ships, see how a modernization engagement addresses this or get in touch and we can walk through your specific setup.
Ivan Lima is a data engineer specializing in database modernization for AI systems. Get in touch if your database needs to be ready for what’s next.