Parameter Sniffing: Why It's Fast for One User and Slow for Everyone Else
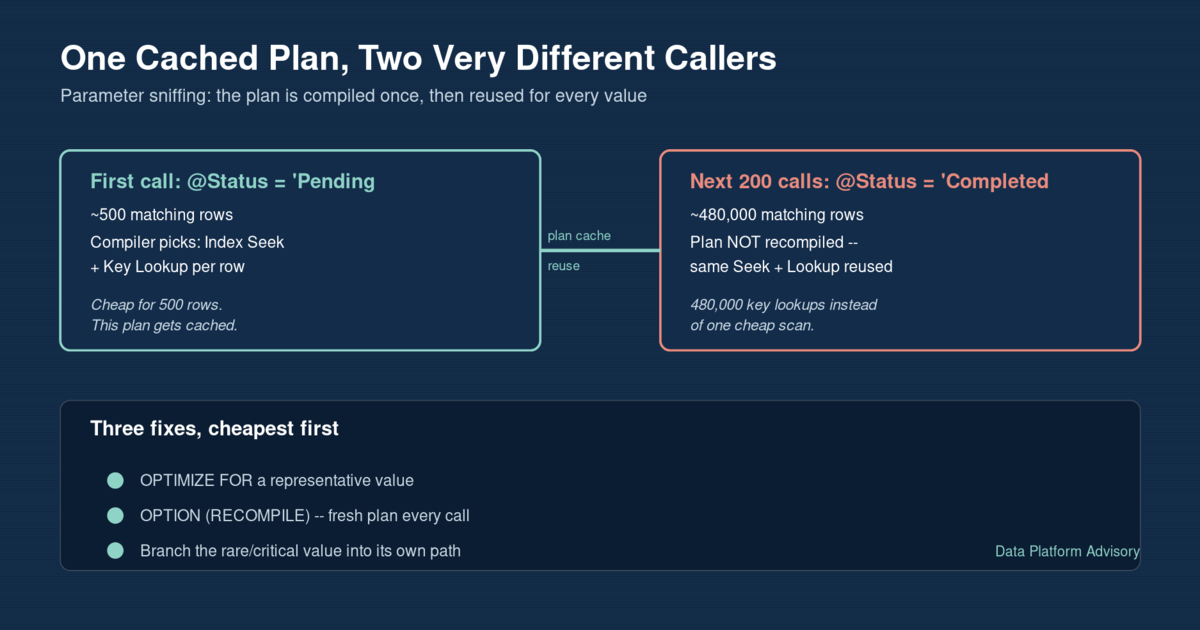
Parameter sniffing is why the exact same stored procedure can return in 20 milliseconds for one customer and time out for the next: SQL Server compiles a query plan for the first parameter value it sees, caches that plan, and then reuses it for every later call regardless of how different the next parameter’s row count is. This post reproduces the bug on purpose with a status filter over a skewed 500,000-row table, diagnoses it from the plan cache instead of guessing, walks through three fixes in order of preference, and shows a scheduled way to catch the next procedure quietly headed the same way.
Key takeaways
- SQL Server caches an execution plan per statement, not per parameter value – the first call’s plan gets reused for every subsequent call with the same query text
- A plan compiled for a rare, low-row-count parameter and then reused for a common, high-row-count one produces exactly the wrong operator choice (seek-plus-lookup instead of scan)
- The tell is a large gap between Estimated and Actual rows on the same operator in the execution plan – not a missing index, not stale statistics
- Three fixes, in order of preference:
OPTIMIZE FORa representative value,OPTION (RECOMPILE)for infrequent calls, or splitting the skewed value into its own branch - AI is a good fit for scoring which procedures show wild duration swings across Query Store executions of the same plan – but which fix to apply stays a human decision
The problem
A support dashboard calls one procedure to pull orders by status:
CREATE PROCEDURE dbo.GetOrdersByStatus
    @Status VARCHAR(20)
AS
BEGIN
    SET NOCOUNT ON;
    SELECT OrderId, CustomerId, OrderTotal, OrderDate
    FROM dbo.Orders
    WHERE OrderStatus = @Status
    ORDER BY OrderDate DESC;
END
The Orders table is skewed the way real order tables usually are: about 96% Completed, 3% Shipped, under 1% Cancelled, and a sliver – maybe 500 rows out of half a million – sitting at Pending. Nothing about the procedure itself is wrong. It has a supporting index on OrderStatus. It reads clean. And yet on some mornings it’s instant, and on others the same query against the same table times out.
The pattern that gives it away: whichever value happens to be the first call after a cache clear (a deployment, a failover, a DBCC FREEPROCCACHE, or just the plan aging out) decides how every other call performs until the next recompile. If an operations dashboard happens to check Pending orders first thing in the morning, SQL Server compiles a plan built for ~500 rows – an index seek plus a key lookup for each match, which is cheap at that volume. Every call after that reuses the exact same cached plan. When the next caller asks for Completed, SQL Server doesn’t recompile just because the row count is now 480,000 instead of 500 – it runs the seek-plus-lookup plan it already has, which means 480,000 individual key lookups instead of one index scan.
That’s the whole bug: not a missing index, not bad statistics, not a bad query – a plan that was correct for the parameter it was compiled for and stayed cached for a parameter it wasn’t.
The expert fix
Before changing anything, confirm it’s actually sniffing and not something else. Pull the cached plan’s stats for the procedure:
SELECT
    p.name AS ProcName,
    qs.execution_count,
    qs.total_logical_reads / qs.execution_count AS AvgLogicalReads,
    cp.plan_handle
FROM sys.dm_exec_procedure_stats qs
JOIN sys.procedures p ON p.object_id = qs.object_id
JOIN sys.dm_exec_cached_plans cp ON cp.plan_handle = qs.plan_handle
WHERE p.name = 'GetOrdersByStatus';
Then re-run the procedure with Include Actual Execution Plan on and check the Index Seek operator’s tooltip: Estimated Number of Rows will show something close to 500 – what the plan was compiled for – while Actual Number of Rows shows roughly 480,000. That gap, on the same operator in the same plan, is the signature. It’s worth ruling out stale statistics first with DBCC SHOW_STATISTICS, since a bad estimate from old statistics looks superficially similar, but here the histogram is current – the estimate is only wrong because it belongs to a different parameter than the one running.
With that confirmed, there are three fixes, and which one fits depends on the traffic pattern:
Optimize for the value that actually dominates. If one value accounts for most real calls – here, Completed at 96% – tell the optimizer to always compile for that shape, regardless of which value happens to run first:
ALTER PROCEDURE dbo.GetOrdersByStatus
    @Status VARCHAR(20)
AS
BEGIN
    SET NOCOUNT ON;
    SELECT OrderId, CustomerId, OrderTotal, OrderDate
    FROM dbo.Orders
    WHERE OrderStatus = @Status
    ORDER BY OrderDate DESC
    OPTION (OPTIMIZE FOR (@Status = 'Completed'));
END
Recompile every time. OPTION (RECOMPILE) throws away plan caching entirely for this statement and compiles a fresh, parameter-specific plan on every call. Correct every single time, at the cost of CPU on every call – the right trade for a procedure that runs occasionally, the wrong one for something called thousands of times a second.
Split the rare-but-critical value out. Pending is rare, but it’s also the one an operational queue depends on staying fast – it shouldn’t share a cached plan with the high-volume path at all:
ALTER PROCEDURE dbo.GetOrdersByStatus
    @Status VARCHAR(20)
AS
BEGIN
    SET NOCOUNT ON;
    IF @Status = 'Pending'
    BEGIN
        SELECT OrderId, CustomerId, OrderTotal, OrderDate
        FROM dbo.Orders
        WHERE OrderStatus = 'Pending'
        ORDER BY OrderDate DESC
        OPTION (OPTIMIZE FOR (@Status = 'Pending'));
    END
    ELSE
    BEGIN
        SELECT OrderId, CustomerId, OrderTotal, OrderDate
        FROM dbo.Orders
        WHERE OrderStatus = @Status
        ORDER BY OrderDate DESC
        OPTION (OPTIMIZE FOR (@Status UNKNOWN));
    END
END
Free the plan cache and re-test both values afterward: Pending still compiles cheap, and Completed now gets a scan-shaped plan with logical reads in the low thousands instead of one lookup per row. The full seed script, repro, and all three fix options with before/after STATISTICS IO output are in the companion example on GitHub.
The AI-automation angle
Catching this one required someone to notice the dashboard was inconsistently slow and dig into the plan cache by hand. The more useful version is catching which procedures are quietly at risk before someone files a ticket about it.
Query Store already tracks, per plan, the full distribution of execution durations across every call. A procedure whose same cached plan sometimes finishes in 5ms and sometimes in 4 seconds is showing exactly the variance parameter sniffing produces – so a scheduled, read-only query can score every procedure on that variance and flag the worst offenders:
SELECT
    OBJECT_NAME(q.object_id)                              AS ProcName,
    SUM(rs.count_executions)                               AS ExecutionCount,
    MAX(rs.max_duration) / 1000.0                          AS MaxDurationMs,
    MIN(NULLIF(rs.min_duration, 0)) / 1000.0                AS MinDurationMs,
    CAST(MAX(rs.max_duration) AS DECIMAL(18,2))
        / NULLIF(MIN(NULLIF(rs.min_duration, 0)), 0)        AS VarianceRatio
FROM sys.query_store_query q
JOIN sys.query_store_plan p ON p.query_id = q.query_id
JOIN sys.query_store_runtime_stats rs ON rs.plan_id = p.plan_id
WHERE q.object_id <> 0
  AND rs.last_execution_time >= DATEADD(DAY, -1, SYSUTCDATETIME())
GROUP BY q.object_id, q.query_id, p.plan_id
HAVING SUM(rs.count_executions) >= 20
   AND CAST(MAX(rs.max_duration) AS DECIMAL(18,2)) / NULLIF(MIN(NULLIF(rs.min_duration, 0)), 0) >= 10
ORDER BY VarianceRatio DESC;
Run daily, that produces a ranked list: which procedures have a cached plan whose worst execution is 10x-plus its best, over a meaningful number of calls. A human reviews the list and decides, per procedure, whether OPTIMIZE FOR, OPTION (RECOMPILE), or a split path is the right fix given how that specific procedure is actually called – the watcher’s job stops at the report. It never adds a query hint, never forces a plan with sp_query_store_force_plan, and never touches the procedure definition on its own. That’s the right boundary for this kind of automation: AI is well suited to scanning Query Store across every procedure on an instance and surfacing the pattern nobody’s watching manually, but the actual trade-off between compile cost and plan stability is a judgment call that belongs with whoever owns that workload. The full watcher query and a PowerShell scheduling wrapper are in the companion example.
If a procedure in your environment is “sometimes fast, sometimes not” and nobody’s traced it back to which parameter compiled the cached plan, see how a modernization engagement addresses this or get in touch and we can walk through what’s actually happening.
Ivan Lima is a data engineer specializing in database modernization for AI systems. Get in touch if your database needs to be ready for what’s next.