N+1 Queries: Catching the ORM Pattern Quietly Killing Your DB
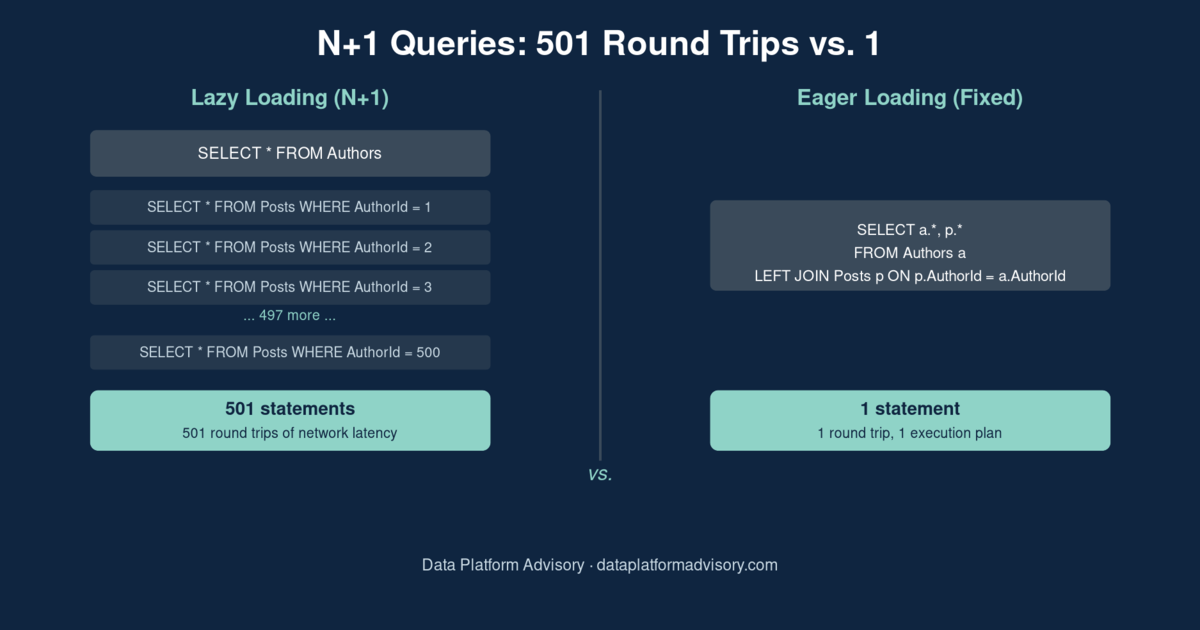
An N+1 query problem is what happens when your ORM fetches a list of parent rows with one query, then silently issues one additional query per row to fetch each row’s related data — turning a page that should cost 1 query into a page that costs 501. It’s one of the most common performance bugs in production applications, and one of the hardest to catch in code review, because every individual query involved looks completely fine.
Key takeaways
- N+1 happens when lazy-loading a to-many relationship inside a loop — each query is cheap, but the count scales with your row count
- It’s invisible to “slow query” alerting because no single statement ever crosses a slow-query threshold; the cost is in the count, not any one call
- The fingerprint in
sys.dm_exec_query_statsis a very highexecution_counton near-identical, cheap, parameterized query text - The fix is eager loading: collapse the N+1 round trips into one set-based
JOIN, using.Include()in EF Core,joinedload()in SQLAlchemy, orJOIN FETCHin Hibernate/JPA - A scheduled, read-only watcher can flag N+1 candidates from the plan cache automatically — but the actual code fix should always go through a human-reviewed pull request, not an automated change
Why this is easy to miss
Most performance monitoring is built around finding the slow query — the one that takes 3 seconds and shows up at the top of a “top queries by duration” report. N+1 doesn’t work that way. Each of the 500 queries generated by an author list page might run in 1-2 milliseconds and use a handful of logical reads. Nothing about any single execution looks like a problem.
The cost shows up in aggregate: 500 round trips at even 2ms of network latency each is a full second of pure waiting before the page can render, and that’s before counting the per-call overhead of query compilation, connection pooling, and whatever the driver’s protocol layer adds per statement. Under concurrent load, it’s worse — every one of those 500 statements is competing for a spot in a pooled connection alongside every other request hitting the same endpoint.
This pattern shows up constantly in ORM-backed applications because it’s the default behavior, not an edge case. Entity Framework, Hibernate, SQLAlchemy, and most other ORMs implement “lazy loading” on navigation properties precisely so that touching author.Posts inside a loop transparently issues a query — which is convenient right up until someone does exactly that inside a loop over hundreds of rows.
What does the N+1 fingerprint look like in the database?
You can confirm N+1 objectively, without reading a line of application code, by querying SQL Server’s plan cache:
SELECT TOP 20
    qs.execution_count,
    qs.total_logical_reads,
    qs.total_elapsed_time / 1000.0 AS total_elapsed_ms,
    SUBSTRING(st.text, (qs.statement_start_offset/2) + 1,
        ((CASE qs.statement_end_offset
            WHEN -1 THEN DATALENGTH(st.text)
            ELSE qs.statement_end_offset END
            - qs.statement_start_offset)/2) + 1) AS query_text
FROM sys.dm_exec_query_stats qs
CROSS APPLY sys.dm_exec_sql_text(qs.sql_handle) st
WHERE st.text LIKE '%FROM dbo.Posts WHERE AuthorId%'
ORDER BY qs.execution_count DESC;
A single parameterized statement with an execution_count in the hundreds, each execution cheap on its own, is the signature. Compare that against total_elapsed_time: summed across every execution, this one query shape is frequently the largest time sink tied to a given page load — it just never shows up that way in a report sorted by per-call duration.
The expert fix: eager loading
The fix is to tell the ORM to fetch the related rows up front, in the same round trip, instead of lazily on first access. At the SQL level, that means replacing 501 statements with one set-based join:
SELECT
    a.AuthorId,
    a.AuthorName,
    a.Email,
    p.PostId,
    p.Title,
    p.PublishedAt
FROM dbo.Authors a
LEFT JOIN dbo.Posts p ON p.AuthorId = a.AuthorId
ORDER BY a.AuthorId;
One statement, one round trip, and — assuming AuthorId on Posts is indexed — one execution plan that’s typically a scan on Authors joined to an index seek on Posts. The result set has one row per post rather than one row per author, so application code groups it back into the author -> [posts] shape client-side. That regrouping is exactly what the ORM does internally when you opt into eager loading instead of lazy loading:
- Entity Framework Core:
context.Authors.Include(a => a.Posts).ToList(); - SQLAlchemy:
session.query(Author).options(joinedload(Author.posts)).all() - Hibernate/JPA:
SELECT a FROM Author a JOIN FETCH a.posts
Before deploying the fix, verify it against the same sys.dm_exec_query_stats query used to diagnose the problem — the 500-execution query shape should stop accumulating new executions, replaced by a single execution of the joined query per page load. SET STATISTICS IO/TIME ON around both versions makes the difference concrete: dozens of scan/seek operations and hundreds of statement executions collapse into a single statement with one execution plan.
One caution: eager-loading everything by default just trades N+1 for over-fetching. If a list page never needs the related rows, don’t .Include() them — the fix is to load exactly what that specific code path needs, not to reflexively eager-load every relationship everywhere.
The AI-automation angle
The diagnostic query above works, but nobody’s going to run it by hand after every deploy. A scheduled watcher can score plan-cache entries against the N+1 heuristic automatically — high execution_count, no JOIN in the text, low average logical reads per call — and log candidates to a review table:
INSERT INTO dbo.NPlus1CandidateLog
    (QueryTemplate, ExecutionCount, AvgLogicalReads, TotalElapsedMs, SuspicionScore)
SELECT
    LEFT(st.text, 500),
    qs.execution_count,
    qs.total_logical_reads / NULLIF(qs.execution_count, 0),
    qs.total_elapsed_time / 1000.0,
    CAST((qs.execution_count * 1.0)
        / NULLIF(qs.total_logical_reads / NULLIF(qs.execution_count, 0), 0) AS DECIMAL(10,2))
FROM sys.dm_exec_query_stats qs
CROSS APPLY sys.dm_exec_sql_text(qs.sql_handle) st
WHERE qs.execution_count > 100
  AND st.text LIKE 'SELECT%WHERE%=%'
  AND st.text NOT LIKE '%JOIN%'
  AND (qs.total_logical_reads / NULLIF(qs.execution_count, 0)) < 50;
This is deliberately a report generator, not an autofix. It never rewrites application code and never touches an ORM’s mapping configuration — it can’t, because the actual fix lives in code the database can’t see. What it does is surface the candidate early, with enough evidence (execution count, per-call cost, elapsed time) that a developer can go straight to the relevant repository method and add eager loading, instead of waiting for a vague “the dashboard feels slow” ticket to eventually get triaged back to this exact root cause. A human still reviews every row and approves the fix through a normal pull request — the watcher’s only job is to make sure the candidate doesn’t sit unnoticed for months.
Full example on GitHub has the complete seed script, the reproduce-and-fix walkthrough, and the watcher query, tested end to end against a scratch SQL Server instance.
This kind of gap — a correctness-safe pattern hiding behind cheap, high-volume queries — is exactly the sort of thing that needs both instrumented pipelines and someone reading the plan cache regularly. If your data platform doesn’t have that instrumentation in place yet, or your team doesn’t have the time to review plan-cache reports on a schedule, get in touch — this is the kind of gap-finding Data Platform Advisory does for a living.
Ivan Lima is a data engineer specializing in database modernization for AI systems. Get in touch if your database needs to be ready for what’s next.