Stale Statistics: The Silent Killer of Good Execution Plans
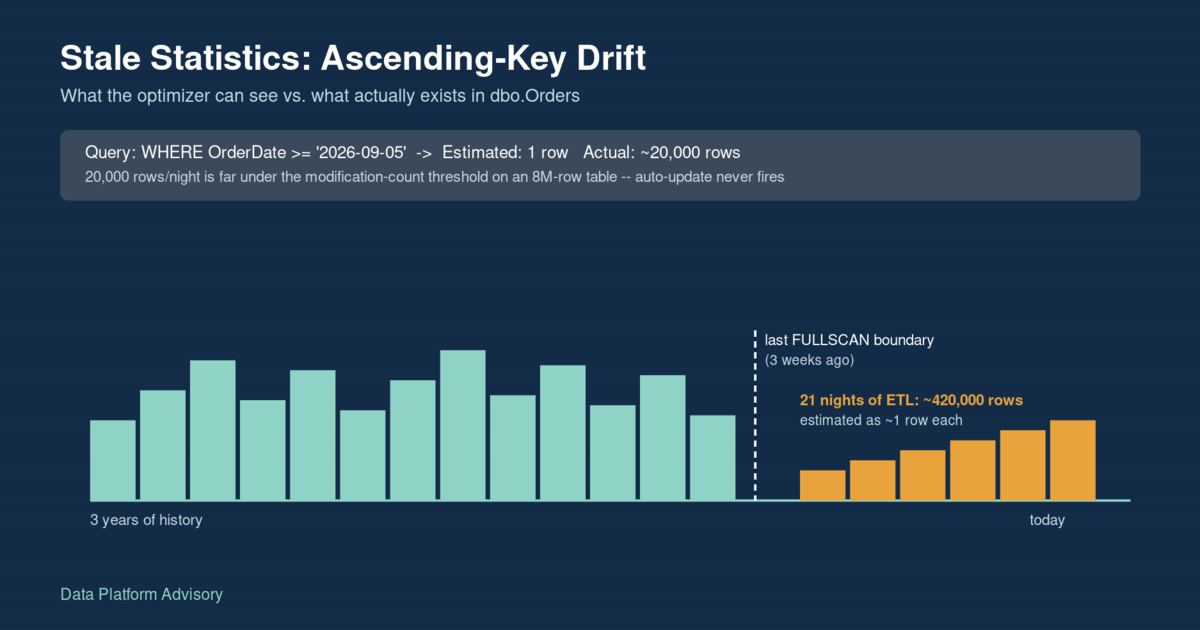
A query that filtered WHERE OrderDate >= '2026-09-05' should have been trivial: a narrow date range on an indexed column, tens of thousands of matching rows. Instead it crawled, because the optimizer estimated 1 row would match and built a plan around that guess – a Key Lookup running once per row, fine at 1 row and ruinous at 20,000. Nothing was fragmented, no maintenance job had failed, and AUTO_UPDATE_STATISTICS was on the whole time. The statistics were just stale in a way row-modification counters don’t catch on a large table with a steadily growing column.
Key takeaways
- SQL Server’s auto-update statistics threshold is a percentage of the table’s row count at last update – on an 8-million-row table, 20,000 new rows a night is nowhere near the ~5-10% typically needed to trigger a refresh, even under the dynamic threshold most instances run today
- The failure mode isn’t random staleness – it’s specifically ascending-key columns (dates, identities, sequences), where every new row falls past the edge of the last recorded histogram step and gets estimated at roughly zero
sys.dm_db_stats_properties()showsmodification_counteras a raw count, not a percentage – always compare it againstrowsfrom the same view before deciding a statistic looks “fine”- The fix is a targeted
UPDATE STATISTICS ... WITH FULLSCANon the affected index, not a blanketsp_updatestatssweep, which usesrowcountsampling and can miss the exact same edge-of-histogram gap - AI is well-suited to running a daily drift check across every statistic on an instance and ranking candidates by staleness and modification percentage – which ones actually need a
FULLSCAN, and when, is still a call for a human who knows the workload
The problem
An Orders table backs a daily operations dashboard: order counts and totals by date, filtered to whatever range someone picks. The table has 8 million rows, a nonclustered index on OrderDate, and a nightly ETL job that appends roughly 20,000 new orders. Nothing about the schema or the index is wrong, and AUTO_UPDATE_STATISTICS has been on since the database was created.
Three weeks after the last full statistics rebuild, someone filters the dashboard to “today,” and the query that used to return in under a second now takes twenty. SET STATISTICS IO, TIME ON shows a huge logical read count for a query that should touch a handful of index pages. The execution plan shows why: an Index Seek on IX_Orders_OrderDate estimates 1 row, feeds a Key Lookup, and that Key Lookup runs once per row actually returned by the seek – roughly 20,000 times instead of once.
This is the ascending-key problem, and it’s common precisely because it doesn’t trip any of the usual alarms. SQL Server’s default auto-update behavior triggers a statistics refresh once accumulated modifications cross a threshold expressed as a percentage of the table’s row count at the last update – historically a flat 20%, and since trace flag 2371 became default behavior under compatibility level 130+ (SQL Server 2016 and later), a dynamic threshold that shrinks as tables get larger, but still a percentage (Microsoft, Statistics documentation; Brent Ozar, Changes to Auto Update Stats Thresholds in SQL Server 2016). On an 8-million-row table, even the more aggressive dynamic threshold needs several hundred thousand modified rows before it fires. Three weeks of 20,000-row nightly loads adds up to roughly 420,000 rows – getting closer, but the query above broke long before that threshold was crossed, because the problem was never about volume. It was about where those rows land.
Every new row’s OrderDate is later than anything in the last full-scan histogram. The optimizer’s cardinality estimator treats values past the histogram’s final recorded step as almost nonexistent – it has no data point telling it otherwise. So a filter on “today,” which might match tens of thousands of rows, gets estimated the same way a filter on a genuinely rare value would: as if almost nothing matches. That’s a fundamentally different failure from “statistics are old” in the generic sense – a table that only ever gets updates spread evenly across its existing key range can run with old statistics far longer before the plans go bad, because the distribution the optimizer already knows about is still roughly correct. An ascending key breaks that assumption every single day.
The expert fix
Start with the two numbers that matter, both from sys.dm_db_stats_properties() – not just “how long ago” but “how long ago, relative to how much has actually changed”:
SELECT
    sp.last_updated,
    sp.rows                AS rows_at_last_stats_update,
    sp.modification_counter,
    (SELECT COUNT(*) FROM dbo.Orders)       AS current_row_count,
    (SELECT MAX(OrderDate) FROM dbo.Orders) AS current_max_orderdate
FROM sys.dm_db_stats_properties(OBJECT_ID('dbo.Orders'), 2) sp; -- stats_id for IX_Orders_OrderDate
On the reproduction table used for this post, last_updated sits three weeks behind current_max_orderdate, and modification_counter is around 420,000 against a rows_at_last_stats_update of roughly 8,000,000 – about 5%, comfortably under most auto-update thresholds, which is exactly why nothing fired automatically.
Confirm the actual damage by running the affected query with the plan on (Ctrl+M in SSMS) and comparing estimated vs. actual rows on the seek:
SET STATISTICS IO, TIME ON;

SELECT OrderId, CustomerId, OrderTotal
FROM dbo.Orders
WHERE OrderDate >= '2026-09-05'
  AND OrderDate <  '2026-09-06';

SET STATISTICS IO, TIME OFF;
Estimated rows: ~1. Actual rows: ~20,000. That four-orders-of-magnitude gap is what pushes the optimizer toward a per-row Key Lookup plan instead of a scan or a plan with a properly sized memory grant – the classic estimate-vs-actual mismatch that shows up as a thin arrow in the plan feeding a fat one.
The fix is a targeted, full-scan statistics update on the specific index:
UPDATE STATISTICS dbo.Orders IX_Orders_OrderDate WITH FULLSCAN;
WITH FULLSCAN matters here, not the default sampled update. A sampled update reads a percentage of rows and can easily miss thin, recent data at the edge of an ascending key – especially right after the exact kind of gap this post describes, where the newest rows are a small fraction of the table. sp_updatestats, the common “just refresh everything” hammer, only updates statistics whose modification counter is nonzero and does so with default sampling – it will often skip the real fix for precisely this problem, because it optimizes for speed across every statistic in the database rather than accuracy on the one that matters (Erin Stellato / SQLskills, Updating SQL Server Statistics Part I).
Re-run the same query after the update. Estimated rows on the seek should land close to the ~20,000 actual, and the plan typically shifts away from the per-row Key Lookup toward whatever access pattern actually fits that row count. Logical reads and elapsed time both drop by an order of magnitude or more on the reproduction table – the query didn’t get faster because the index changed; it got faster because the optimizer finally had an accurate picture to plan against.
For related patterns on the same table – what a bad plan driven by a different kind of estimate mismatch looks like, and how fragmentation (a separate problem from stale statistics, though they get confused constantly) should actually be diagnosed – see Diagnosing and Fixing a Slow Query and Index Bloat and Fragmentation.
The AI-automation angle
Manually checking every statistic on an instance for this exact pattern doesn’t scale, and “run UPDATE STATISTICS WITH FULLSCAN on everything nightly” is its own cost problem on a large database. What scales is a scheduled, read-only check that scores every statistic by two signals together – days since last update, and modifications as a percentage of the row count at that update – and logs only what’s worth a human looking at:
DECLARE @StaleDays INT = 14;
DECLARE @PctThreshold DECIMAL(5,2) = 10.0;

INSERT INTO dbo.StatsDriftLog (SchemaName, TableName, StatsName, LastUpdated,
    DaysSinceUpdate, RowsAtLastUpdate, ModificationCounter, PctModifiedOfLast, RecommendedAction)
SELECT
    s.name, t.name, st.name, sp.last_updated,
    DATEDIFF(DAY, sp.last_updated, SYSUTCDATETIME()),
    sp.rows, sp.modification_counter,
    CAST(sp.modification_counter AS DECIMAL(18,4)) / NULLIF(sp.rows, 0) * 100,
    CASE
        WHEN sp.rows > 0 AND CAST(sp.modification_counter AS DECIMAL(18,4)) / sp.rows * 100 >= @PctThreshold
            THEN 'UPDATE_NOW'
        WHEN sp.modification_counter > 0 AND DATEDIFF(DAY, sp.last_updated, SYSUTCDATETIME()) >= @StaleDays
            THEN 'REVIEW'
        ELSE 'OK'
    END
FROM sys.stats st
JOIN sys.tables t ON t.object_id = st.object_id
JOIN sys.schemas s ON s.schema_id = t.schema_id
CROSS APPLY sys.dm_db_stats_properties(st.object_id, st.stats_id) sp
WHERE t.is_ms_shipped = 0 AND sp.modification_counter > 0;
This never runs UPDATE STATISTICS itself – it only reads and logs. Full runnable version, with the log table definition and a scheduling wrapper, is in the companion repo below. Run it daily, review the UPDATE_NOW rows, and decide from there whether a FULLSCAN fits the current maintenance window or needs to wait – that judgment call, weighing query criticality against the cost of a full scan on a large table, stays with whoever owns the workload. What the automation buys back is the part that doesn’t need judgment: noticing, every single day, before a dashboard user does.
If stale statistics like this are already costing your team production incidents, or you’re not sure how much of your database’s plan instability traces back to exactly this pattern, get in touch – this is the kind of gap that’s cheap to find and cheap to fix once someone’s actually looking for it.
Ivan Lima is a data engineer specializing in database modernization for AI systems. Get in touch if your database needs to be ready for what’s next.